Visual aids are useful tools for teaching and learning. Faculty can use them to explain complex relationships and assess student understanding by having them create their own.
Concept maps
A concept map is a diagram that represents the relationships between different concepts.
We can use concept maps to demonstrate our understanding of a topic or to represent how different viewpoints understand the relationships between ideas.
Concept maps can serve as a reference point for writing or a focus for a classroom discussion.
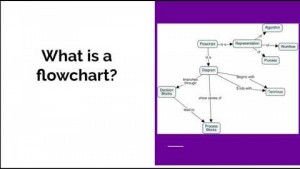
Flowcharts
Flowcharts represent complex processes and can help us to visualize whole series of consequences to actions.
They can represent processes from a wide range of disciplines, such as chemical reactions, organizational or governmental procedures, or steps in the development of research or creative works.
Tools for making concept maps and flowcharts
There are several applications and web-based tools that can help to create concept maps and flowcharts.
- Cmap
- LucidChart
- Miro
Choosing and Using Visual Aids
Watch a series of instructional technology videos on YouTube, starting with "Concept Mapping and Flowcharts," embedded below.
The first video in the series is "Concept Mapping and Flowcharts."